
Mark Voortman
On June 1st, 2009 Air France flight 447 disappeared from the radar somewhere above the Atlantic Ocean and all aboard perished in the crash.1 Initially, the cause was unknown and although bodies and debris were found in the days after the crash, the exact location of the plane remained a mystery for an extended period of time. The first three search attempts that altogether took approximately a year were without result.
Let's not switch to a lighter topic just yet and look at cancer diagnosis. Many types of cancers have screening tests that can help detect its occurrence. For convenience, let's focus on CT scans for the detection of lung cancer. Suppose we have two (randomly selected) patients A and B, where A tests negative and B tests positive. Also assume that the incidence rate of lung cancer is 1/1,000 and the test detects all occurrences of lung cancer but also has a false positive rate of 5%. This means that for 5% of the people that do not have lung cancer the test will indicate that they do. It is important to point out that false positives result in anxiety but also lead to additional procedures that are unnecessary, costly, and could be risky and adversely affect the patient. Based on the test the probability that patient A has cancer is zero, but what is the probability for B? Think about it for a moment and make a guess.
What these two problems have in common is that both can use Bayesian principles to make inferences about outcomes. The basic idea is that prior knowledge (e.g., flight path of the plane and incidence rate of cancer) is updated with new information (e.g., search results and the outcome of cancer screening) to obtain a posterior probability, which simply is an updated likelihood of each outcome given the new data. The formula used for updating beliefs is also known as Bayes' rule.
For flight 447 a probability map was created after the third search attempt using a Bayesian search approach. The map combined all known prior knowledge with information gained in the searches to identify the most likely locations of the plane. One of the additional advantages is that it is easy to update the map with new search results. When the search efforts resumed almost a year later the plane was found within a week.
The result for the cancer diagnosis for patient B can be directly estimated using Bayes' rule. I will spare you the calculation but the probability after the test becomes only 0.02! How could that be? The underlying reason is that the incidence rate is small in the general population so even if you test positive (remember that 1 in 20 that do not have cancer test positive) the probability of cancer is still very small (the odds have increased by a factor 0.02/0.001=20). This phenomenon is known as the base rate fallacy.2 Now let's just hope your doctor knows about it.
To get some more insight into the Bayesian approach, let's look at an easy to understand example of a series of coin tosses. We assume that the process is driven by a parameter h that encodes the probability of heads. Now suppose that out of 10 coin flips 4 came up heads and 6 came up tails. One way to estimate parameter h is to simply look at the proportion of heads, i.e., h=4/10. Now consider a second scenario in which there were 100 coin flips this time with 40 heads and we go through the same calculation, i.e., h=40/100=4/10. This is exactly the same outcome as before but was derived from much more data! How do we distinguish between the two?
Instead of collapsing h into a point estimate, i.e., one specific value, we model h as a probability distribution that carries information about the certainty of the parameter. You can think of this distribution starting out as uniformly distributed between zero and one and then becomes more peaked around the correct value of h as more data and evidence arrives, see also Figure 1. The red line is the situation after 10 data points where we are not that confident yet about h. When more data comes in we can increase our confidence which is captured by the blue line. A suitable distribution for this purpose would be the beta distribution.3
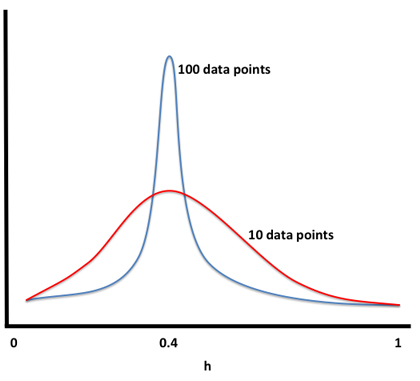 Figure 1
The coin toss example is Bayesian because parameter h is not treated as an objective truth value that we have to estimate, but instead we encode the uncertainty in our beliefs about this parameter using a distribution that is updated when new data becomes available. In fact, this could be a recursive process because this distribution in turn has additional parameters, called hyperparameters, that have to be determined. In other words, an approach can be more or less Bayesian depending on how all the parameters are modeled. A true Bayesian always talks about distributions and never about point values!
Are you familiar with linear regression? There is a Bayesian version as well where you pick a prior distribution for the coefficients and then you update them based on data. When you want to make a prediction for the dependent variable the output is actually not just a value, but a distribution that captures the uncertainly in the prediction! You can always calculate the mean or median if you want to reduce it to a value. Knowing how confident you should be in a prediction can be very important.
In the future I will discuss Bayesian networks which are closely related to the above discussion.4 They can be used for probabilistic reasoning similar to Bayes' rule but in a more general way. Funnily enough, a Bayesian network does not necessarily use Bayes' rule or is even fully Bayesian! However, one of the main advantages of Bayesian networks is that they can be used to represent causal relationships, but that's a discussion for next time.
Sources:
1http://en.wikipedia.org/wiki/Air_France_Flight_447
2http://en.wikipedia.org/wiki/Base_rate_fallac>
3http://en.wikipedia.org/wiki/Beta_distribution
4 http://en.wikipedia.org/wiki/Bayesian_network

Mark Voortman