Mark Voortman
The most exciting phrase to hear in science, the one that heralds new discoveries, is not “Eureka” but “That’s funny...”
- Isaac Asimov
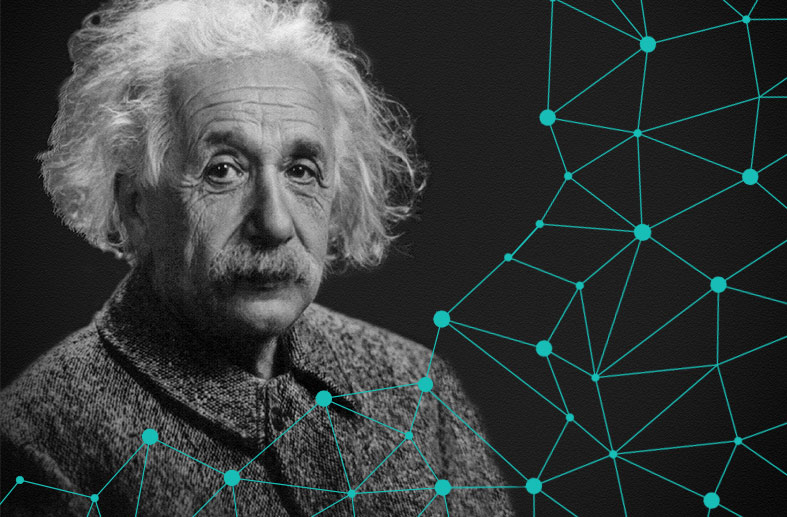
Newton’s law of universal gravitation made successful predictions for hundreds of years. Then one odd anomaly in Mercury’s orbit changed everything.[1,2] It eventually led to one of the most successful discoveries in modern physics, namely the theory of General Relativity which was formulated by Albert Einstein over a hundred years ago. It has been one of the most well-tested theories in science and no prediction made by the theory has been falsified so far. GPS and many other things would not exist without it. Yet, it all started with a simple data anomaly.
This year of data anomaly in higher education also provides ample opportunity to learn. It is true that anomalies in data science are a double-edged sword; on the one hand, it could impact current predictions and future modeling, but on the other hand, there is an opportunity to learn from data that would otherwise not have been captured.
For the remainder of this post, it may be helpful to look at this from a couple of different angles, namely the current (now/summer) tactics, the September postmortem diagnosis (after matriculation), and moving forward with future model updates. We will discuss each of these below, starting with current tactics.
Current Tactics
It is impossible to know right now how exactly the pandemic is going to affect the accuracy of the current predictions (especially as far as variables that are not captured directly in the data are concerned), although keeping a close eye on indirect indicators such as deposit trends will be very insightful. While we did not choose to be in this current situation, we can certainly determine how we react to it. We want to use all the data and insights that are available to be proactive and consider the following courses of action right now or over the course of the summer (this is not meant to be an exhaustive list):
- It is extremely important to capture as much granular data as possible for future analysis. Make sure to clearly label how the data was captured and where it came from.[3]
- Keep using the ranking of likelihood scores as these should still be useful (everyone is dealing with this crisis), with the caveat that certain student subpopulations may be affected much more than others and should be treated separately. For example, it may make a lot of sense to exclude international students, as well as students that live far away from campus, as we know these groups will be more negatively impacted than others. (For Othot Partners, this is easily done in the Othot Platform by using filters.)
- Physical visits have been replaced by virtual visits. While the effectiveness of virtual visits is currently unknown, it is still possible to get some idea of how these visits will affect enrollment. For example, one could look at the prediction without any virtual visits and use that as a baseline. Then, by filling in virtual visits as physical visits, we should be able to get an upper bound on the prediction. These are two “extreme” scenarios but will help us in estimating the most likely scenario.
- Closely track important metrics over time, especially variables that relate to behavior, and assess the impact by comparing these to prior years. This includes student deposit dates, completion of housing forms, etc. For example, it would be interesting to look at the lag between regular visits and deposit dates compared to virtual visits and deposit dates (this will tell you something about the effectiveness of them).
- During a regular enrollment cycle, it is possible to identify students that benefit most from a campus visit. These students are highly impacted by the pandemic as they cannot visit, but these students can, and probably should be offered virtual visits (which may be even personalized). Similarly, students that are sensitive to aid may be impacted by the economic impact of the pandemic and may need some help (being flexible with aid appeals may be sensible too). These students can be given extra attention.
- Othot Partners use the Platform’s "Deposit Model" to focus attention on students (or student populations) most likely to melt. One could start with likelihood scores, which should help catch students that are not engaging in the right behavior as these variables will have a negative impact on the likelihood score.
September Postmortem Diagnosis
September is the time when the true impact of the pandemic on yield becomes known and we can start answering questions about the impact with some certainty using data and outcomes. This explanation can provide important insights on how to move forward. Here are some examples of analyses that could be performed (many others exist):
- An obvious start is to compare the predictions (both on an aggregate as well as individual level) to the actual outcomes. This can be done separately for the different stages of the model as the insights are likely to be different (I.e., for applicants, admits, etc.). More specifically, doing a decile analysis on subpopulations may be especially illuminating (Othot is in the process of developing an automated tool for this) as not everyone may have been impacted by the pandemic in the same way. The insights from this analysis will give us the true impact of the pandemic.
- In addition, through Othot’s “waterfall” visuals, i.e., explainable AI functionality, we can assess which variables were driving the individual and aggregate predictions. By comparing these waterfall models across years, the impact of the pandemic should become clear.
- It is now also possible to diagnose the effectiveness of virtual visits by comparing how many students enrolled versus how many students would have enrolled if these were physical visits. There are obviously confounding variables, but it may be possible to use the students that did not visit to separate out the effect of the pandemic.
- One interesting area of research could also be transfer students, as this population may be impacted differently by the pandemic than first-time freshmen.
Future Model Updates
As was pointed out in the previous section, the full impact of the pandemic on the 2020 enrollment year will not be exactly known until September. Depending on the data and insights that arise, several possible scenarios would have to be considered moving forward (Othot investigated all of these in an update to this post.):
- It may turn out, however unlikely, that the impact of the pandemic on enrollment is somewhat limited. Case in point, in challenging economic times it is not uncommon and unheard of to seek education. In this scenario, we would still have to deal with the changes in data collection and timings which is manageable, but the overall approach would not have to change drastically.
- If it turns out that the 2020 year is a true outlier, and the expectation is that the 2021 enrollment year would look more like 2019, we could proceed to build models from data that excludes the 2020 year.
- A hybrid scenario is also possible, that is, one could use all data for prospect, inquiry, and applicant models, but then exclude the 2020 data from the admit and deposit models. Similarly, variables can be included and excluded per phase based on the impact of the pandemic.
- Up to this point, the Othot models predict the likelihood of enrollment as that is what eventually matters. However, given the current situation, it may be more robust to build models that predict advancement to the next “stage.” Othot is planning to actively investigate this modeling approach over the summer.
- Special care will have to be taken with data that was collected in March and beyond as it will have been impacted by the pandemic. For example, can we simply consolidate physical and virtual visits or do these have to be kept as separate variables? Only the data will tell us.
- Finally, it is always a good approach to pick several options so that the different scenarios can be run through the Othot Platform for the best-informed decisions.
The anomaly in Mercury’s orbit provided Einstein with an opportunity to learn something new that was of tremendous value. Similarly, the 2020 anomaly in higher education due to the pandemic can be used to study the data and modeling and gain new actionable insights!
Do you want to know what happened with the Year of Data Anomaly? Read the update, "Five Modeling Lessons Learned From the Pandemic."
Notes:
2. Coincidentally, Mercury was also the name of the first release of the Othot Platform years ago, and we are currently hard at work on the 3.2 Earth release (4.0 Mars will be next).
3. See Data and Analytics in a World of Virtual Campus Visits


Mark Voortman