
Ashton Black

A classification model works to identify to which of a group of categories a record belongs. Binary classification is a type of classification model, operating to identify which of two classes a record belongs to (frequently a yes/no classification). The model is built using historical data where the final decisions are already known, and then outputs a probability per individual as to how likely they were to belong to the "yes" class, based on the surrounding data.
Future records, where the final decisions aren’t determined yet, can then be run through this historical model, and will also be given a probability. These probabilities can be interpreted and put to use as such, or a threshold can be applied to ultimately assign each individual to the "yes" class or the "no" class. A threshold can be determined by the model itself to optimize specific performance measures, or it can be arbitrarily assigned by the user. Furthermore, a threshold of 0.7, for example, means that all individuals given a probability greater than 0.7 are assigned to the "yes" class, and all below 0.7 are assigned to the "no" class.
For historical data we can compare these predicted classes to the actual classes to determine how well the model performed overall, and how well it performs within each category. This is where a table called a confusion matrix comes into play. A confusion matrix is used to describe and evaluate the performance of a classification model. NOTE: It is important to evaluate the model prior to making new predictions to ensure we are satisfied with the performance.
To better explain the value of a confusion matrix, let’s look into two classification examples of extremely different severities: A restaurant using data to determine if a customer will order dessert with their dinner and a bank using data to detect instances of fraud. Let’s assume that both models use a threshold that optimizes overall accuracy at 83%. At first glance that 83% is seemingly impressive, but let’s break this down into raw numbers.
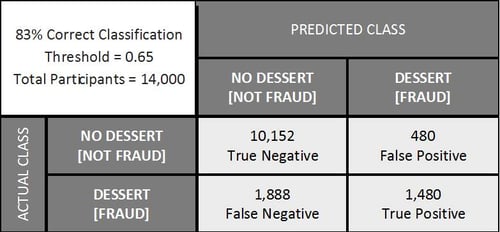
The true positive and true negative blocks reveal that the model correctly classified 11,632 records. Individuals in the false positive block were assigned by the model to the decision=YES class, when they actually did not order dessert. Similarly, individuals in the false negative block were assigned to the decision=NO class, when they did order dessert.
When breaking down the data we see that we have unbalanced classes, meaning that the number of individuals who actually ordered dessert is significantly different than the number of those who did not. We also see that the current model clearly does a much better job of correctly identifying who will not order dessert than it does in identifying who will. Although the overall accuracy is at 83%, we can see from the confusion matrix that the model does not perform at this level for both categories. On the other hand, while in some cases we may want to perform as best as possible in each category, in this scenario a strong overall accuracy may still provide the restaurant useful information.
Now assume that this same confusion matrix above is representing our fraud detection problem. Accuracy still indicates a very successful model, but the numbers show that, again, we do a great job of identifying which cases are not actually fraud, but we fail to detect almost half the cases of fraud. This type of error can be extremely costly for a bank. So, although accuracy is at 83%, this may not be the best threshold or model for this type of business. To deal with this issue, a different threshold can be assigned to instead optimize the trade-off between false negatives and false positives. This confusion matrix is shown below.
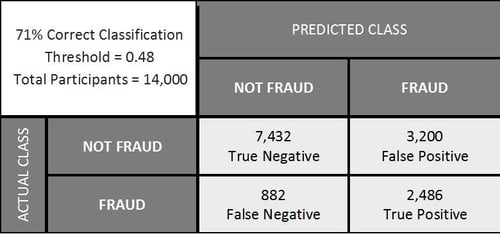
Here we see accuracy has dropped to 71% and there are 2,720 more false positives, but the percentage of fraud instances detected has jumped from 44% to 74%. While these numbers are in reference to cases of fraud that have already occurred, we can expect the performance of this model to be rather consistent when applied to future cases - with sufficient data, of course! I won’t discount that additional false positives mean dispersing additional resources to further investigate and control these situations flagged as suspicious activity (only to resolve them as not fraudulent). However, the damage - financially, legally, and to the bank’s reputation - avoided by early detection of fraud may be unquantifiable.
While accuracy may be a sufficient performance measure for some instances, this is not a safe assumption for all cases, especially when there are unbalanced classes as we saw in the example above. Each individual implementation of a classification model is likely to be different. Therefore, depending on how the output needs to be used, each model may be optimized at a distinctly different threshold. Confusion matrices break down this output, allowing you to better understand the model and determine the optimal threshold for your situation.
Sources:
https://www.acl.com/pdfs/DP_Fraud_detection_BANKING.pdf<
https://en.wikipedia.org/wiki/Binary_classification

Ashton Black