
Mark Voortman
Previously I have written about the Bayesian approach1 and caveats in data science.2 In both of these Original Thoughts™ I referred to Bayesian networks (BNs)3, and this will be the topic for today. Now, I'm sure that all of you know that a Bayesian network is just a joint probability distribution that factors in conditional independences between variables in an efficient way, but let's step through this in a little more detail just for the uninitiated.
 Figure 1
An example BN is displayed in Figure 1. As you can see, there are several nodes that are connected with arrows (also called arcs or edges). Nodes are simply variables and arrows represent influences between nodes. What kind of scenario is presented here? Suppose that every Sunday morning you flip a coin to see if you will go to the zoo. If it lands heads you will go, if it lands tails you won't go. This explains the arrow between CoinToss and VisitZoo, however, there is another factor that influences this decision: the weather. If the weather is too bad then you won't go and this explains the arrow between Weather and VisitZoo. Finally, we have a SpendMoney node that depends on whether you actually go to the zoo but also the weather, because if it's very hot or cold you have to spend more money on beverages to keep you cool or warm in order to be comfortable watching the elephants, giraffes, and penguins.
While the scenario is straightforward and it should be easy to understand all the variables and influences, you may have realized that everything so far has been qualitative. There is also a quantitative counterpart to the graph which captures probabilities that can be used to do exact calculations. For example, we already encountered coin flipping1 and for now we will just say that the probability of heads without any other evidence is 0.5 4, which is also called a prior probability. The VisitZoo variable is modeled with a conditional distribution because it depends on both the Weather and CoinToss. It is also important to point out that if the coin toss lands heads and the weather is good, it does not necessarily imply that you will go to the zoo with a probability of 1. There could be other obstacles, such as an illness or a broken car, that makes it that predictions are usually not deterministic but probabilistic.
How do we use all this? One very powerful feature is evidential (data-driven) reasoning. Suppose someone wants to know whether you are going to the zoo today. Initially, we can use the prior probabilities to calculate this probability which is quite low because several things have to line up correctly. Then you look out of the window and you see that the weather is nice, and BN calculations will show that the probability of going to the zoo will have increase compared to before. We still have no certainty because we don't (yet) know what the outcome of the coin flip is but we can now better hedge our bets. If we finally observe that you are going to the zoo, we can draw additional conclusions: you will spend money and the coin flip came up as heads (the latter is an instance of explaining away that is also discussed here).
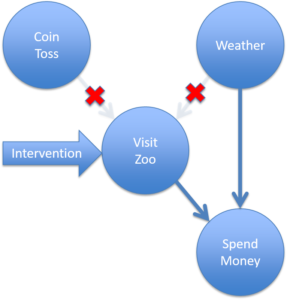 Figure 2
But we can do even more interesting and powerful things when we start thinking in causal terms. At this point I have to mention the disclaimer that BNs do not necessarily represent causality, so we will now make the assumption that arrows are causal, thereby making it a causal BN. What if I want to make sure you don't go to the zoo? I can either change the weather, which seems difficult, or I could sabotage your coin so that it comes up tails when you flip it. This is called an intervention (or manipulation) and forces a variable into a certain value or state. A consequence of this is that incoming arrows will be removed, because we remove the direct influences by intervening. A good example of this is where I sabotage your car and directly interfere with your zoo going plans such that the coin flip and weather become irrelevant (see Figure 2). Within a business context it is very important to identify the variable(s) that are causes of a desired effect, because then we can have some confidence that our decisions and policies will have the intended effect.
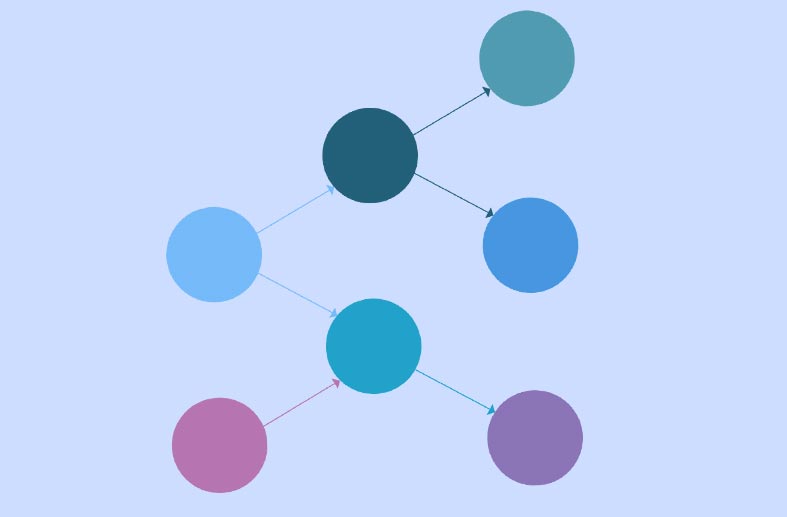
How do we obtain a causal BN model? The beauty is that it can be deduced from data under certain assumptions. When we look at the arrows in Figure 1 we can see three basic patterns of nodes: (1) A →B → C, (2) A ←B → C, and (3) A → B ← C. Pattern 1 is called a causal chain and Smoking → LungCancer → Death is an example. Pattern 2 is called a common cause and the ice cream example from this blog post2 follows this structure. Pattern 3 is called a v-structure and is quite different from Patterns 1 and 2. Only in Pattern 3 are A and C independent before observing B and dependent after observing B. This is easy to see if we look at the earlier discussed example: the coin toss is independent of the weather but becomes dependent after we observe whether you visit the zoo (it is sometimes said the v-structure is activated). In simple English this means that the weather does not tell you anything about the coin toss and vice versa, until you observe whether you visit the zoo. Conversely, smoking and death are correlated even if we don't know whether someone has lung cancer or not. However, as soon as we know someone has lung cancer that will determine their health outcome and the fact that they smoked becomes irrelevant.
Now the final step: we can deduce Patterns 3 from data based on statistical tests that measure dependence. Most statistical tests allow us to know whether there is a relationship but cannot tell us the direction of the arrow, however, a combination of dependencies does allow us to deduce the direction of some arrows (those in Pattern 3). In addition, we also know that if three variables do not form a Pattern 3 they must be one of the other two patterns. The consequence is that once we have identified one Pattern 3 in the data it is usually possible to deduce more arrows. For example, we can use statistical tests to identify CoinToss, Weather, and VisitZoo as a v-structure. Because those same tests will indicate that CoinToss, VisitZoo, and SpendMoney do not form a v-structure, we know that VisitZoo must cause SpendMoney.
Predicting the effect of interventions is crucial in many problems, but not all. In certain domains you can get away with mere correlations, of which fraud detection is a good example. Other domains cannot do without causal predictions; doctors are supposed to cure a disease and not the symptoms, which is impossible to do without knowing what causes what. Any time you want to make changes in a system you should have some knowledge of the causal structure to prevent bad results2 (e.g., imposing a policy that forbids eating ice cream). The good news is that we can use data to help us find these truly actionable insights. This is a big part of the reason why Othot can help shape your company's future!
Sources:
1 http://othot.com/what-do-searching-for-a-plane-and-a-doctors-diagnosis-have-in-common/
2 https://othot.com/blog/ive-got-my-data-now-where-do-i-get-my-science/
3 https://en.wikipedia.org/wiki/Bayesian_network
4 The assumption that the parameter is simply a point value (0.2) is incidentally also the reason why Bayesian networks are not necessarily Bayesian as was mentioned [1] . If we model the parameter as a beta distribution then the Bayesian network becomes more Bayesian. This principle can be applied recursively. Another way of putting it is that 'Bayesianness' is a matter of degree.

Mark Voortman